Median
In this class, We discuss Median.
For Complete YouTube Video: Click Here
The reader should have prior knowledge of arithmetic mean. Click Here.
We understand Median with an example.
Example:
1) 25, 20, 15, 35, 18.
First, arrange the given data in ascending order.
15, 18, 20, 25, 35
The middle number in the data is the median value.
The above example has an odd number of data values.
Example 2:
Even number of data values
25, 20, 15, 35, 18, 19
After sorting values are 15, 18, 19, 20, 25, 35.
Arithmetic mean of middle two values is the median value.
median = (19 + 20)/2 = 19.5
When is the median value good as a measure of central tendency?
The median value is not affected by outlier points.
Example:
Employee salaries: 19, 20, 25, 28, 30, 35, 250.
Median = 28
Most of the employee’s salaries are around 19k – 35k.
The CEO’s salary is 250k.
The outliers will affect the mean value much to move the mean away from the central tendency.
The Median will give the central tendency in the data consisting of outliers.
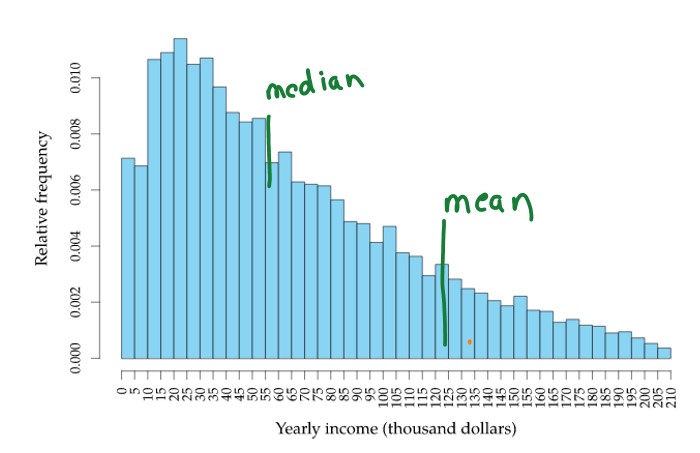
Skewed Data go with a median value
The below diagram shows the right-skewed data of population income.

The Median in the skewed data gives the exact measure of central tendency.
The mean moves towards the largest income.
When is the median value not good to take?
Example:
19, 20, 21, 25, 35.
The median value is 21.
Same data set to keep 21 in the middle and change the remaining values.
10, 15, 21, 45, 85.
The median value is 21.
the median value is not affected by the change in the remaining values.
If there is a situation where the measure of central tendency should get affected by the change in remaining values Median is not good.
