Mean Standard Deviation and Variance
In this class, We discuss Mean Standard Deviation and Variance.
For Complete YouTube Video: Click Here
The reader should have prior knowledge of the measure of dispersion. Click Here.
Mean Deviation or Mean Absolute Deviation
The mean deviation is another way to find the measure of dispersion.
Mean Deviation = 1/N Σ fi |Xi – X’|
‘fi’ is the frequency values
‘xi’ is the data value
x’ is the mean of the distribution.
|xi – x’ | is the absolute value.
N is the number of data points.
The measure of dispersion is to find the spread of the data based on the mean value.
In mean absolute deviation, we find dispersion of data from the mean.
Example:
The below table shows the data values.
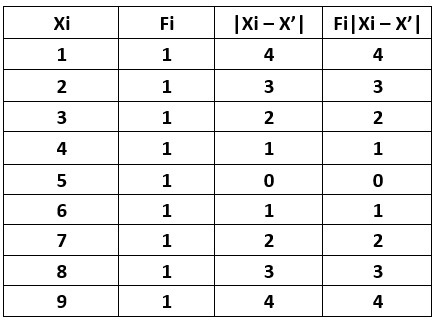
N = 9
X’ = (1+2+3+4+5+6+7+8+9)/9
X’ = 5
xi – x’ for the first data value is 1 – 5 = -4
We are taking the absolute value. so |x1 – x’| = 4
The last two columns show the values of |xi – x’ | and fi|xi-x’ |.
Mean Deviation = 1/N Σ fi |Xi – X’|
Σ fi |Xi – X’| = 20
MD = 1/9 (20)
MD = 2.2
Standard Deviation:
Standard Deviation = σ = √1/N Σ fi (Xi – X’)^2
The standard deviation is similar to the mean absolute deviation.
We square the value (xi – x’) in standard deviation.
We square the value to avoid negative numbers.
We use square roots in the complete formula.
The standard deviation is affected much by outliers because we use the square.
If we have most of the outliers, we go with mean absolute deviation.
Variance = square of the standard deviation.
variance = σ^2