Understanding Normal or Gaussian Distribution
In this class, We discuss Understanding Normal or Gaussian Distribution.
The reader should have prior knowledge of continuous probability distribution. Click Here.
The normal distribution is very important in probability and statistics.
Normal or Gaussian Distribution:
80% of the real-life examples fit the normal distribution.
We take an example and understand normal distribution.
Example:
Take the heights of the students. We considered Total Hundred students.
The heights of the students are a continuous probability distribution.
The height maybe 5.4, 5.401, 5.5, 5.55, . . etc.
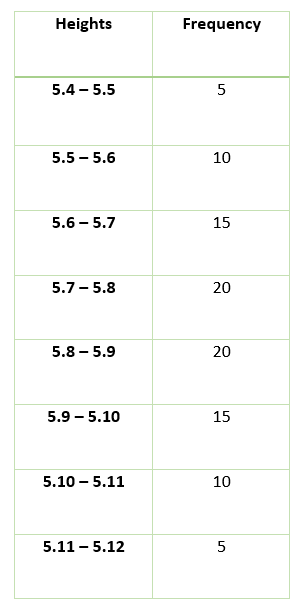
The below table shows the data for hundred students.
The below diagram shows the heights of students plotted in 2-dimensional coordinates.
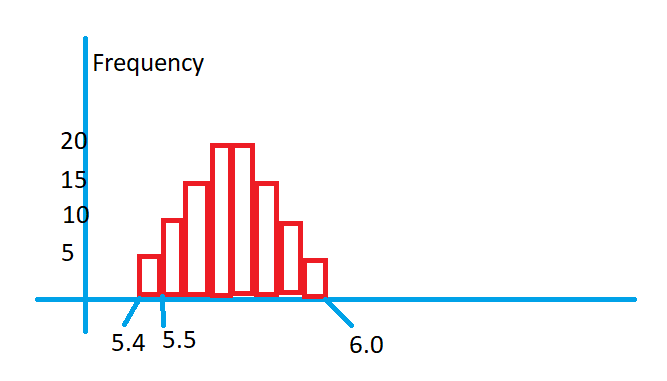
On the x-axis, we are taking the heights of students.
On the y-axis, we take the number of students’ frequency or probability value.
5.4 to 5.5, we have five students.
The above diagram shows how the distribution heights of students.
The below diagram shows the function which satisfies the data distribution of student heights.
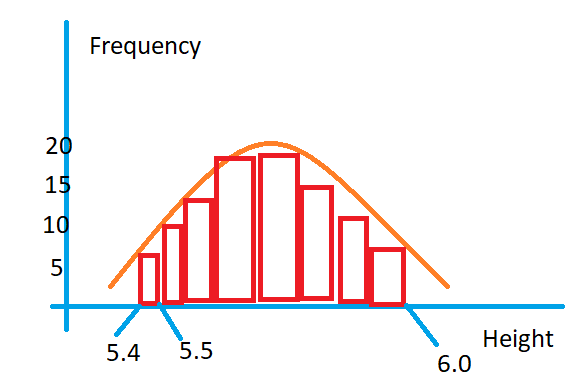
If our data satisfies the shape of the above function, we can apply normal distribution.
The normal distribution function should satisfy the condition, and the area under the curve should be 1.
What is the normal distribution function?
We will discuss The function equation in the next class.
Here we provide a graphical understanding of normal distribution.
The below diagram shows the bell shape function.
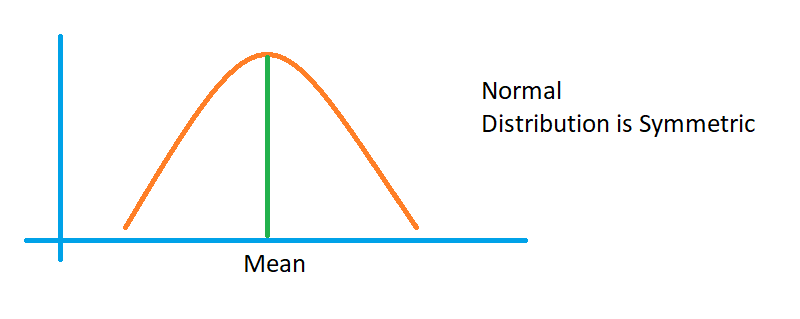
If the data takes the bell shape, we go with normal distribution.
The normal distribution is symmetric.
The mean value is at the centre, and both sides are similar in shape.
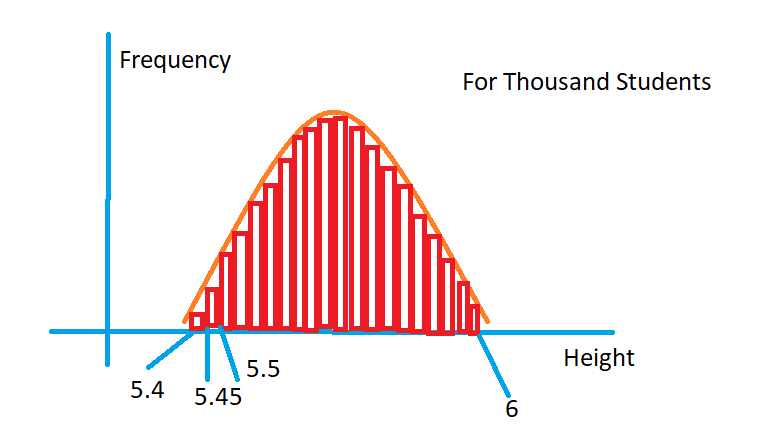
Important: Why have we taken 5.4 to 5.5 intervals? Because we have only a hundred students.
Take a thousand students. We can consider the interval 5.4 to 5.45.
As the interval is reducing, the function is exactly fitting to the data.
The below diagram shows the data distribution for thousand students.
