Understanding PDF of Normal Distribution
In this class, We discuss Understanding PDF of Normal Distribution.
The reader should have prior knowledge of graphical understanding of normal distribution. Click Here.
First, We discuss the example used in the measure of dispersion data analysis example.
Example:
We collected the data on everyday restaurant income.
For 30 days, we collected the data for three different restaurants.
The below diagram shows the three restaurants’ data distribution.
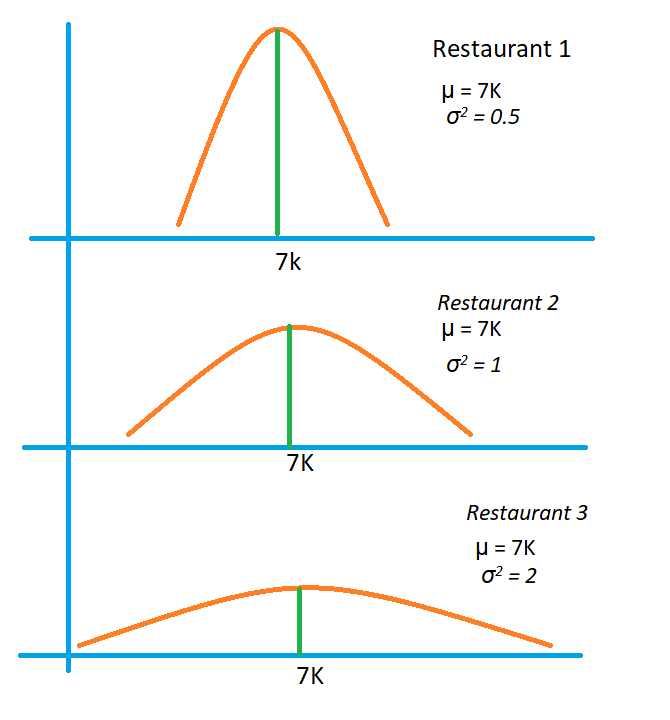
The x-axis is income in thousands.
A y-axis is the number of days the amount is collected.
All three restaurants have a mean value of 7k.
The variance is different for all three restaurants.
The third restaurant has the highest variance.
Keep the graphical understanding of the three restaurants’ distribution.
Observe how the function changes as the variance increases.
Now, We understand the probability density function of normal distribution.
The below equation is the probability density function for normal distribution.
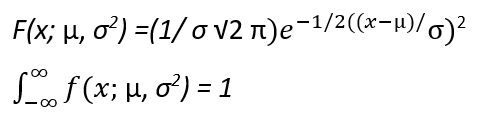
x = random variable
µ = mean value
σ^2 = variance value
µ and σ^2 are the parameters of the PDF.
Always the area under the curve of the probability density function of the normal distribution is 1.
We are not going to mathematical proof for the area under the PDF is 1.
So we can consider the normal distribution equation as PDF.
How does the shape of the normal curve change with mean and variance values?
Understand with an example.
Assume mean = 5 and variance = 1
Take values of random variable x from – infinite to infinite.
The below diagram shows the shape of the function.
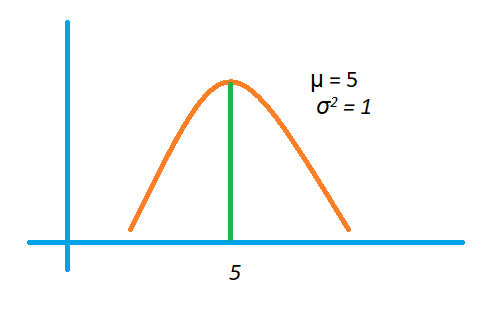
The mean value is five, and the variance is 1. So the function takes the maximum y value at x=5.
Now, from the restaurant’s example.
The first restaurant mean is 7, and the variance is 0.5.
The function moves up to make the area under the curve = 1.
Take the second restaurant distribution.
As variance increases, the function moves down and spreads on the x-axis much to make the area = 1.
The third restaurant has a large variance, so the shape of the function spreads much on the x-axis.
According to mean and variance values, the functions take different shapes.
According to the data, the normal distribution function will take shape.
What happens if we change the mean value?
The below diagram shows the change in mean and same variance.
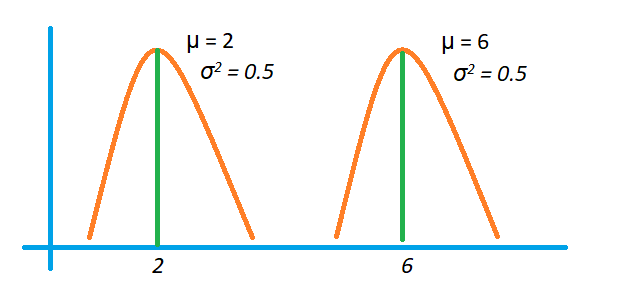
As the mean value changes, the function shifts its shape to the mean.
Important: The normal distribution is symmetric.
The area on the left side of the mean and the right side of the mean are the same.