Finding Probabilities Standard Normal Table
In this class, We discuss Finding Probabilities Standard Normal Table.
The reader should have prior knowledge of standard normal distribution and tables. Click Here.
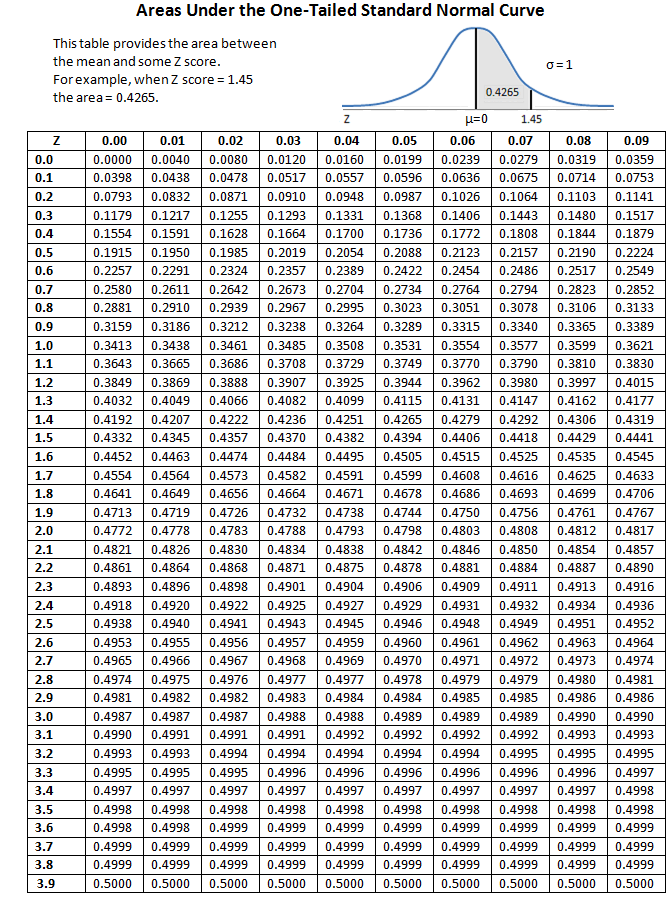
The below table shows the standard normal probability table.

We use the table to find the probabilities of standard normal distribution.
How to find the probability values?
We understand with an example.
Suppose your standard normal random variable value is 1.45. then.
The table provides probability values from 0 to 1.45. We have shown the shaded part in the table.
How to search for probability values using the table?
1.45 value is converted to 1.4 + 0.05.
the value 1.4 is checked along the row, and the value 0.05 on the column.
The value in blocks 1.4 and 0.05 is 0.426.
The probability value is 0.426.
One more example:
The random variable value is 0.25.
Check 0.2 in the row and 0.05 in the column.
The value in the block is 0.0987.
The probability value from 0 to 0.25 is 0.0987.
The column shows the second digit after the decimal.
The row shows the first digit before and after the decimal.
Examples:
1) P(-1 < z < 1)
We apply the below function to find the probability value.
Using a table is an easy way.
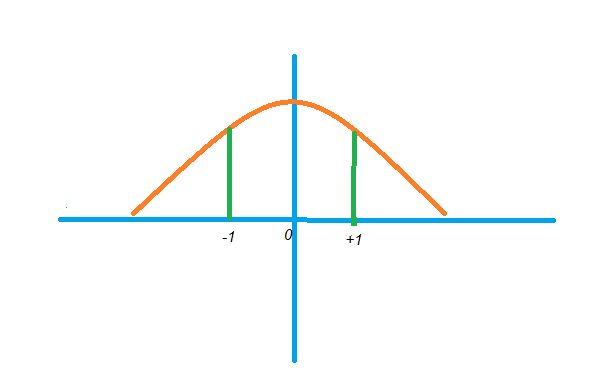
The below diagram shows the graphical intuition of the probability value from -1 to +1.

The random variable Z = 1.00
We find the probability 2 * P(Z).
Why two times P(Z)?
0 to 1 is equal to 0 to -1.
So we do two times P(Z).
From the table P(Z = 1.00) = 0.3413.
= 2 * 0.3413
= 0.683
= 68.3 percent.
2) P(0.87 < Z < 1.28)
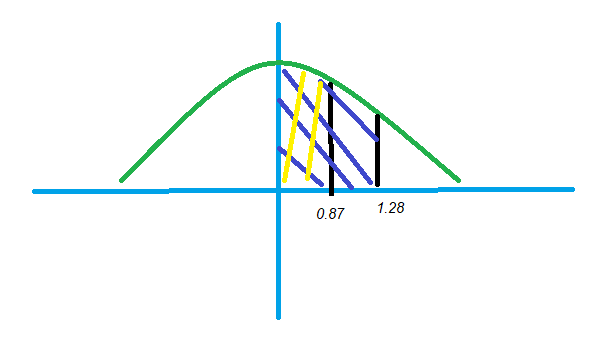
The below diagram shows the graphical understanding of the required probability.

P(Z = 0.87) is yellow line area.
P(Z = 1.28) is blue line area
P(0.87 < Z < 1.28) = P(Z = 1.28) – P(Z = 0.87) observe it from the diagram.
P(0.87 < Z < 1.28) = 0.3997 – 0.3078
3) P( Z > 0.85)
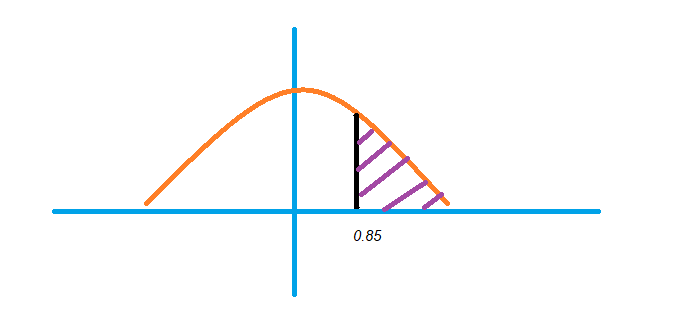
The below diagram shows the required probability.

The right part from the mean value has a probability of 0.5.
The required probability is 0.5 – P(Z>0.85)
= 0.5 – 0.3023
