Measure of Dispersion Data Analytics Example
In this class, We discuss the Measure of Dispersion Data Analytics Example.
For Complete YouTube Video: Click Here
The reader should have prior knowledge of the measure of the central tendency. Click Here.
The measure of Dispersion is also called a measure of spread.
The measure of Dispersion:
The intuition provided in this class helps the reader understand data analysis.
In our next class, we discuss different ways to find the measure of Dispersion.
The measure of Dispersion:
The measure of scatteredness of data, about the average, is said to be a measure of Dispersion.
We go with an example for a better understanding
Example:
Take three restaurant data.
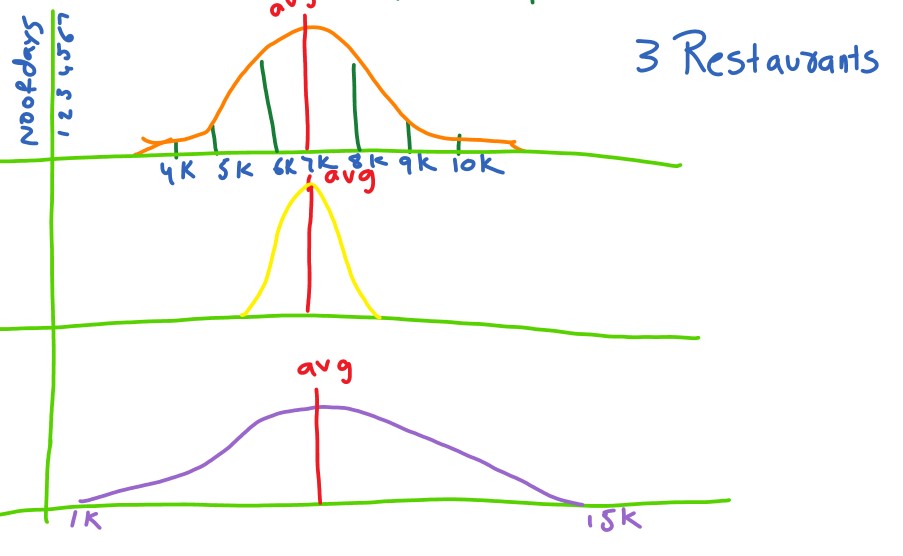
On the x-coordinate, we take each day’s collection in thousands.
On the y-coordinate, we take the number of days.
The below diagram shows the three restaurants’ distributions.
The first restaurant collected 4k for one day. And 5k for three days.
Similarly, We plotted the remaining data in the diagram.
On average, all the restaurants are collecting seven thousand a day.
Suppose someone asked to buy a restaurant. Which restaurant will you buy?
The second one is a good restaurant to buy. Why?
The spread of the data from the average is very less when compared to the remaining restaurants.
Take the third restaurant. Some days we are getting 1k, and some days we get 15k.
The business is not stable.
The business is stable when we consider the second restaurant because the spread is less.
The spread of the data gives the volatility of the data.
The data is uncertain.
Simply taking the average and going to take any restaurant is not a good idea.
As the spread of data increases, there is much information hidden in the data.
Example 2:
Take two areas and collect the house prices in both areas.
The below diagram shows the distribution of data in two areas.
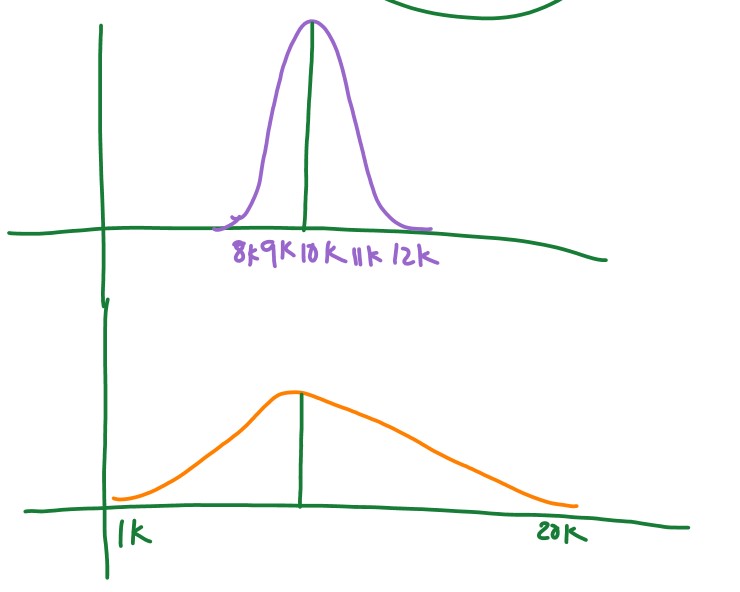
The first area had less spread of data.
We can buy a house in the first area with an average of 10k.
In the second area, we get houses for 1k and some houses for 20k.
Blindly buying a house for an average of 10k in the second area is not good.
We need a deeper analysis of the second area.
Different ways to find the measure of Dispersion:
1) Range
2) Quartile Deviation
3) Mean Deviation
4) Standard deviation