Median for Frequency Distribution
In this class, We discuss finding the Median for Frequency Distribution.
For Complete YouTube Video: Click Here
The reader should have prior knowledge on Median. Click Here.
We take an example and understand how to find the median value given frequency distributions, and we have discrete and continuous distributions.
Discrete frequency distribution:
The data shows the number of hours students study.
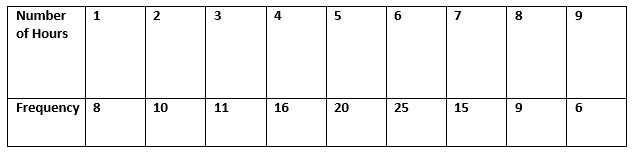
Eight students are studying for one hour every day.
We need to find the median value for the distribution.
The Median is identified by arranging data in ascending order and selecting the middle number.
1,1,1,1,1,1,1,1,2,2. . . .
one hour studied by 8 students. so we write eight ones and then two’s. so on.
Writing the data of all 120 students and selecting the middle value is not possible.
We go with the cumulative frequency method.
The below table shows the data distribution and cumulative frequencies.
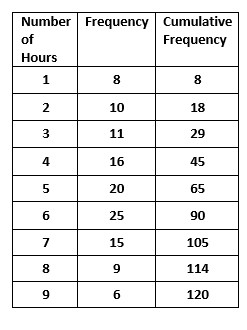
Total students N = 120.
Median = N/2 = 120/2
Median = 60
The value 60 comes to the median class 5.
The median value is 5.
If N is even Median = ((N/2) + (N/2+1))/2
Median Given Continuous values
The below table shows the frequency distribution.
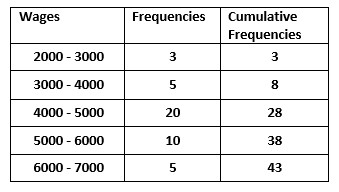
The data shows the wages of employees.
2000 – 3000 three employees in the firm.
First, we need to find the cumulative frequencies.
N = 43
N/2 = 21.5
The value 21 belongs to the median class 4000 – 5000.
Which value do we consider as median? 4000 or 5000.
If we consider 4000 as the median value we get more data values on the right side.
Similarly, If we consider 5000 as the median value we get more data values on the left side.
We need to choose a median value that makes the data values half.
Median is identified using the equation L + (h/f)((N/2) – c)
L is the lower limit of the median class.
In our example 4000 is the lower limit of the median class.
h is the length of the median class.
Length here will give interval. ie. 1000
f is the frequency of the median class.
f gives the number of employees in the median class.
N = Σfi
c is the cumulative frequency of the class preceding to median class.
c = 8
Final equation 4000 + (1000/20)(21.3-8).
Median = 4675.
We got a value between 4000 and 5000.
Understanding the equation:
Example:
The below table shows the frequency distribution.
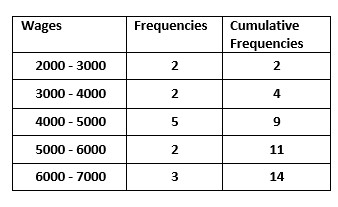
The data is the sample data.
2.1, 2.8, 3.1, 3.9, 4.1, 4.2, 4.6, 4.8, 4.9, 5.2, 5.6, 6.1, 6.9, 6.95.
(h/f) = 200
Each employee is given a 200 value in the median class 4k – 5k.
((N/2) -c) value is 3.
three employees in the median class will be on left and 2 employees on right.
4000 + 200(3) = 4600.