Mode as Central Tendency
In this class, We discuss Mode as Central Tendency.
For Complete YouTube Video: Click Here
The reader should have prior knowledge of the mean and median. Click Here.
Mode:
The mode is defined as the value with a higher frequency in a given set of values.
The mode is a value that appears the most times.
Example:
1, 1, 2, 2, 2, 3, 3, 3, 3, 4, 4, 5, 5, 5,
Mode = 3
Bimodal:
We can have two mode values.
Example:
2, 2, 2, 3, 4, 4, 4, 5, 5
Mode = 2, 4
Tri modal:
we can have three mode values.
2, 2, 2, 3, 4, 4, 4, 5, 5, 5
Mode = 2, 4, 5
Multi-Modal:
More than three-mode values we call multi-modal.
No Mode:
Example:
2, 3, 4, 5
Mode = none
Example: how we use mode in real-time data distribution.
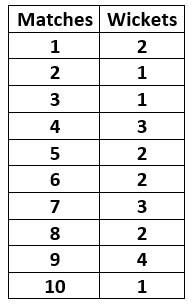
The below table shows the cricket data distribution.

The distribution shows the number of wickets taken by a bowler in ten matches.
Mode = 2
On average, he is going to take two wickets in a match.
The below examples show the use of mode in symmetric and asymmetric distribution.
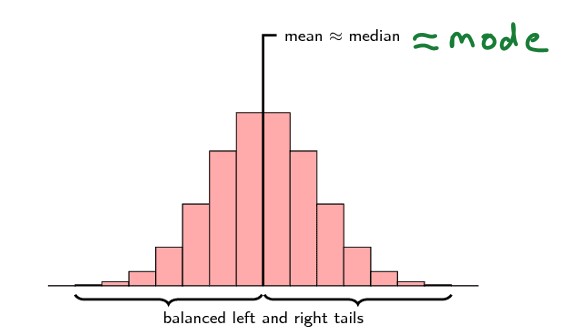
The below diagram shows the symmetric distribution.

Mean, median, and mode are the same values for symmetric distribution.
Mode considered the highest frequency value.
In symmetric distribution, the center value has the highest frequency.
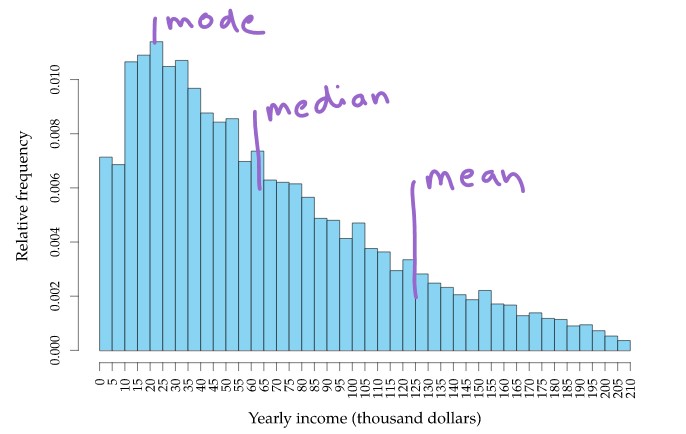
The below diagram shows the asymmetric distribution of population income.

The mean, median, and mode have different values.
We need to choose the mean, median, and mode values according to the application’s needs.
