Quartiles and its Uses
In this class, We discuss Quartiles and its Uses.
For Complete YouTube Video: Click Here
The reader should have prior knowledge of the measure of central tendency. Click Here.
Quartiles:
Quartiles are three points that divide the data series into four equal parts.
Example:
1, 2, 3, 4, 5, 6, 7, 8, 9, 10, 11, 12
Total, we have n observations.
n = 12 in our example
Q1, Q2, and Q3 are quartile points.
The three points, Q1, Q2, and Q3, divide the data into four equal parts.
Q1 is our first quartile point.
25% of the data is left of the quartile value.
Q2 is our second quartile.
50% of the data is left in the quartile Q2.
Q2 is called the median quartile.
Q1 is called the lower quartile.
Q3 is called the upper quartile.
Q1 = ((n +1)/4)th observation
Q2 = ((n +1)/2)th observation
Q3 = (3(n +1)/4)th observation
Use of quartile points
Simply finding the measure of central tendency will not help much in data analysis.
The quartile points help in a deeper understanding of data.
Example: Marks in a class
45, 46, 47, 48, 52, 55, 59, 62, 68, 69
The quartiles help to identify poor students and good students
Quartile points in a symmetric distribution
The below diagram shows the symmetric distribution
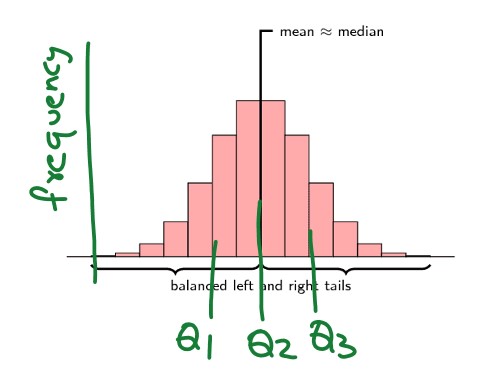
This graphical intuition helps readers to understand the next classes.
Quartiles in asymmetric distribution.
The below diagram shows the asymmetric distribution.
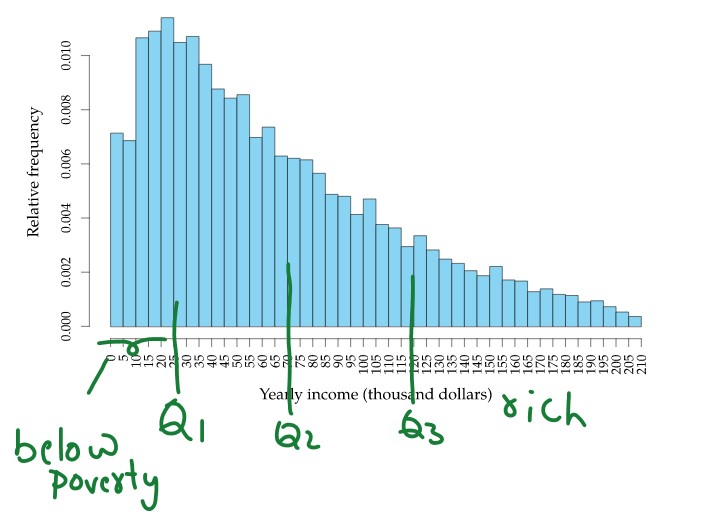
The data before the lower quartile are below the poverty line.
The data after the upper quartile are rich.