Standard Normal Distribution and Probability Table
In this class, We discuss Standard Normal Distribution and Probability Table.
The reader should have a prior understanding of normal distribution. Click Here.
Standard Normal Distribution:
If the normal distribution has mean 0 and variance 1, We call this normal distribution a standard normal distribution.
We use random variable Z to represent a standard normal distribution.
The below equations shows the PDF for standard normal distribution.
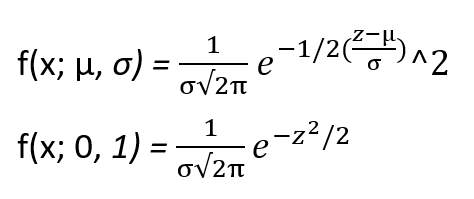
Placing mean 0 and variance one, we get the second equation.
The below diagram shows the standard normal distribution.
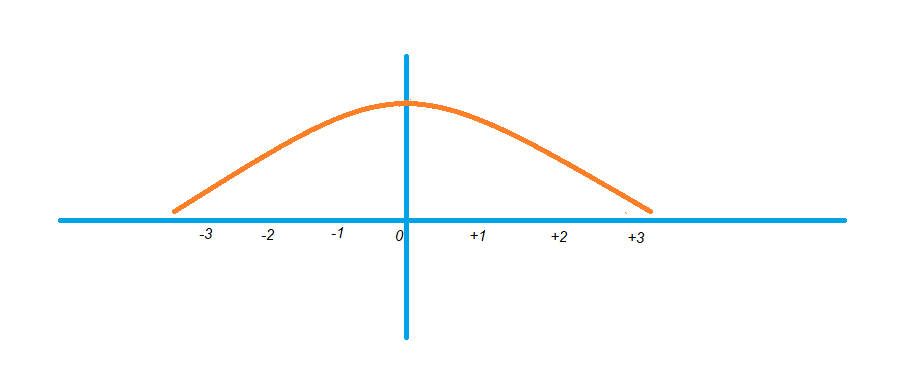
One standard deviation distance from the mean to the left is -1.
Similarly, one standard deviation distance from the mean to the right is +1.
The above diagram shows the values.
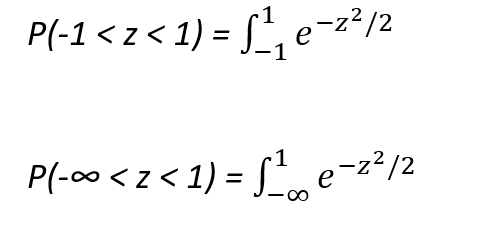
How to find the probability value from -1 to +1?
The below equations show how to find the probability values.
Always differentiating the equation and substituting the values is difficult.
Instead of doing the mathematics, we provided a probability table for standard normal distribution.
The table below identifies the probability values of standard normal distribution.
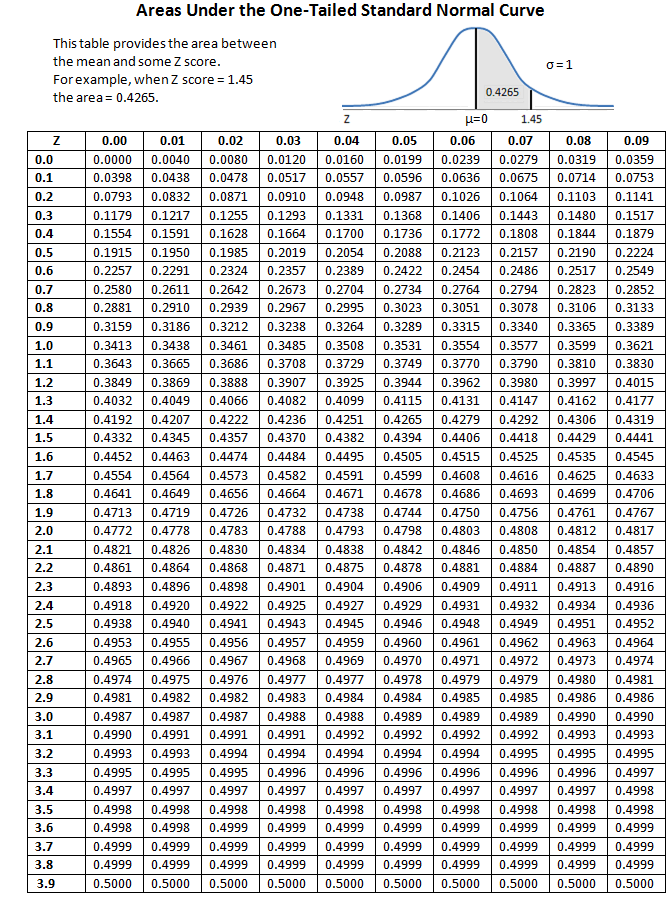
How to use the table? We will discuss this in our next class.
In our coming classes, we will use the same probability table to find the probabilities for other normal distributions.