Symmetric and Asymmetric Distribution
In this class, We discuss Symmetric and Asymmetric Distribution.
For Complete YouTube Video: Click Here
The reader should have prior knowledge of the measure of central tendency. Click Here.
Symmetric Distribution
The graphical intuition about the symmetric and asymmetric distribution of data will help the reader understand the following classes.
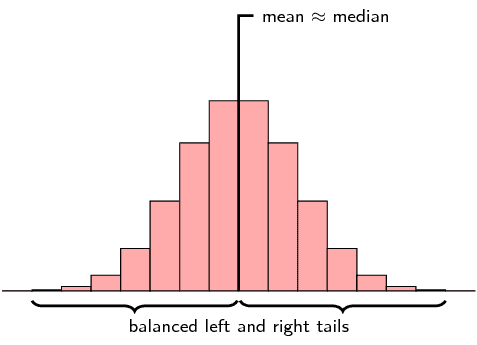
The below diagram shows the distribution of the heights of students.
The below diagram is an example of symmetric distribution.

On X coordinate, we take the heights of students.
On the Y coordinate, we take the frequency values. I.e. the number of students have the given height.
The mean value for the distribution is at the center of the data.
Why do we call symmetric distribution?
The left and right side of the mean looks almost similar. So we consider symmetric distribution.
Asymmetric Distribution
We have right-skewed and left-skewed distributions.
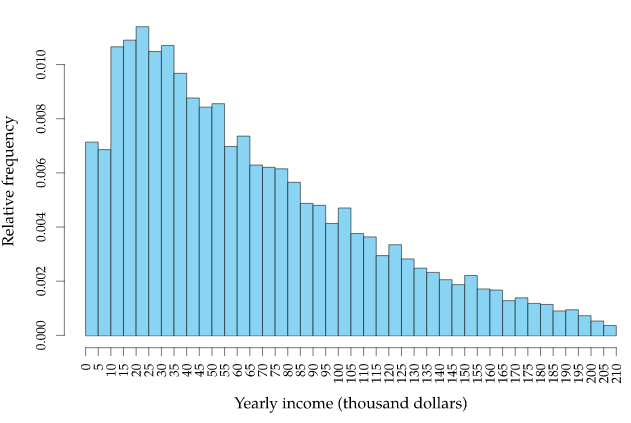
The below diagram shows the right-skewed distribution.

On the X coordinate, we show the annual income.
On the Y coordinate, we show the frequency value. I.e. how many of them are getting the income.
As the income increases, very few people will get a high income.
If we apply to mean as a measure of central tendency for right-skewed data is not appropriate.
The mean value is pulled towards the maximum income.
The mean will not give an exact measure of central value.
In the above scenario median is the best for finding a measure of central tendency.
We discuss median in our next class.
Left Skewed:
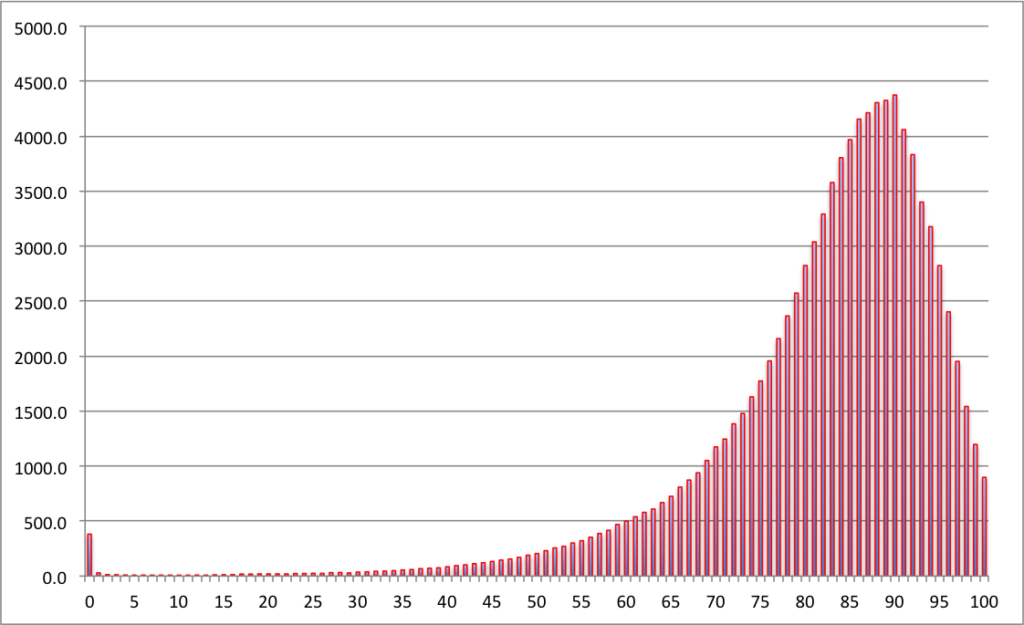
The below diagram shows the example of left-skewed data.

On the X coordinate, we show the population’s death in years.
We show frequencies on the Y coordinate number of persons dying in the given year.
Most of the persons are dying at the age of 55 to 90.
