Box Plot Matplotlib
In this class, We discuss box plot matplotlib.
For Complete YouTube Video: Click Here
The reader should have prior knowledge of the superstore data set. Click here.
Box Plot
First, we refresh the concepts of the median, first quartile, and third quartile.
Median: Take a list of numbers. The median value for the given list of numbers is identified following the below steps.
First, sort the elements in ascending order, and the middle number is considered as the median.
Suppose the list of numbers present is even in length. Take the middle two numbers, and the average value is considered as the median.
Example: list = [11, 4, 6, 8, 6, 9, 3]
After sorting the list is [3,4,6,6,8,9,11]
The median value is 6.
The median value tells half of the elements are below the value median.
First Quartile: The median of the first half elements in the given list is the first quartile.
Example: after sorting, the list is [3,4,6,6,8,9,11].
The first half elements are [3,4,6,6].
The median value is 5. The value five is considered as the first quartile to the list [3,4,6,6,8,9,11].
The first quartile tells one-fourth of the elements are below the first quartile value.
Third Quartile: The median value of the second half elements in the given list is the third quartile.
Example: After sorting the list is [3,4,6,6,8,9,11].
The second half elements are [6,8,9,11].
The median value is 8.5. the value 8.5 is considered as the third quartile to the list [3,4,6,6,8,9,11].
The third quartile tells three fourth of the elements are below the third quartile value.
Take one more example to understand the concept better.
Example: Given list of elements are [1,2,2,2,3,5,6].
The median value is 2. and the first quartile value is 2.
In the above example, the median and the first quartile value are the same. Because more number of similar elements.
The reader should think a little about this example.
Example
The below example shows the program for the box plot.
#simple box plot
list1=[11, 4, 6, 8, 6, 9, 3]
import matplotlib.pyplot as plt
fig = plt.figure(figsize =(10, 7))
plt.boxplot(list1)
plt.show()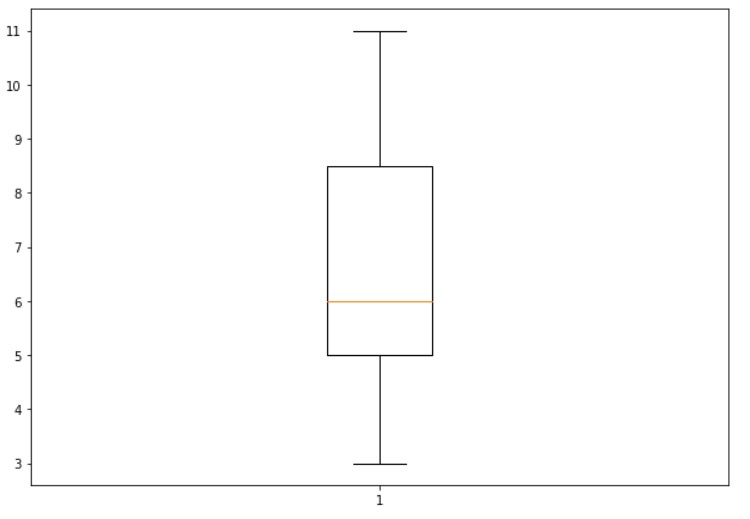
From the above output, the median value is given in orange color.
The box lower line is the first quartile, and the upper line is the third quartile.
The bottom dash is the least value in the list. And the upper dash is the maximum value in the list.
The below example shows the program having median and first quartile same value.
list1=[1,2,2,2,3,5,6]
import matplotlib.pyplot as plt
fig = plt.figure(figsize =(10, 7))
plt.boxplot(list1)
plt.show()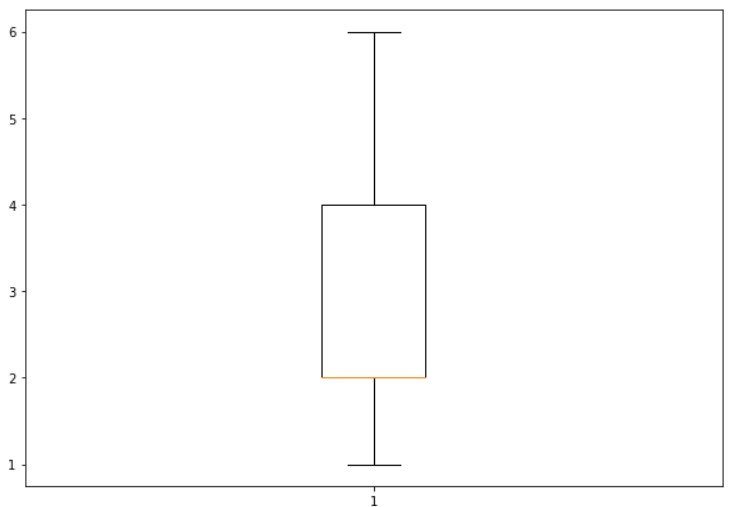
Example on Superstore data set
In the superstore data set, we consider segment and discount to construct a box plot.
From the segment column, we consider consumers and take the list of discounts.
If the box plot is constructed on the list of discounts, we get an idea about the number of products having discounts less than 0.5.
The below example shows the program to construct a box plot for the consumer.
import pandas as pd
df=pd.read_excel('sampledata.xls',sheet_name='Orders')
print(df.head())

consumer=df[df['Segment']=='Consumer']['Discount'].values
print(consumer)

import matplotlib.pyplot as plt
fig = plt.figure(figsize =(10, 7))
plt.boxplot(consumer)
plt.show()
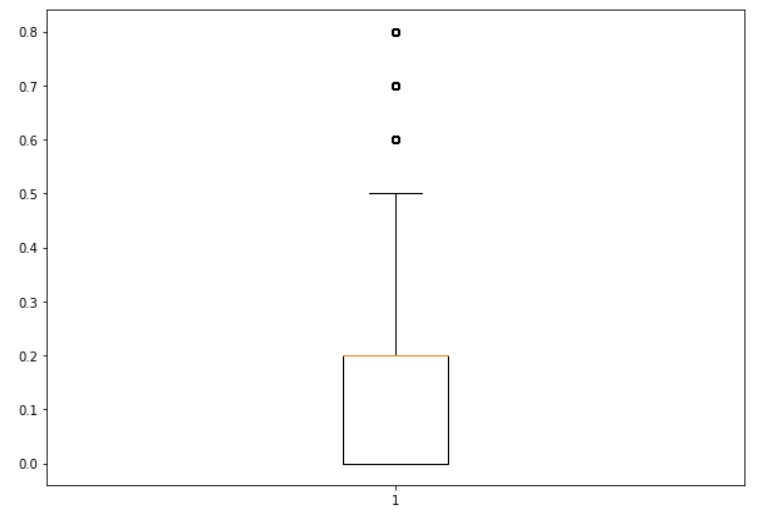
In the above output, we have three dots above the box plot.
The values of the dots are 0.6,0.7, and 0.8.
The above discount values are not considered in the box plot because very few data points are available in the data.
Few products are given discounts 0.8,0.7, and 0.6.
Example on Segment
The below example shows the program to construct a box plot on the segment.
temp1=df.groupby(['Segment'])['Discount'].apply(list)
print(temp1)

import matplotlib.pyplot as plt
fig = plt.figure(figsize =(10, 7))
plt.boxplot(temp1)
plt.show()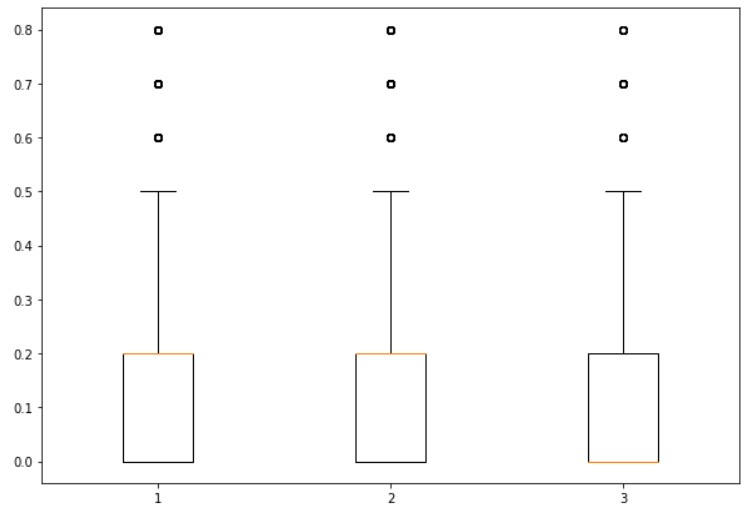
Group the segment and find the list of discounts according to the group.
boxprops capprops and whiskerprops Parameters
We use the boxprops parameter to modify the box properties. In our example, we change color.
The bottom and Upper dash are called caps.
We use capprops parameter to modify the cap properties.
The line extended from box to cap is called whiskers.
We use whiskerprops parameter to change the properties of whiskers.
The below example shows the program to change the color of box, cap, and whiskers.
import matplotlib.pyplot as plt
fig = plt.figure(figsize =(10, 7))
plt.boxplot(temp1, boxprops=dict(color='green'),capprops=dict(color='red'),whiskerprops=dict(color='violet'))
plt.show()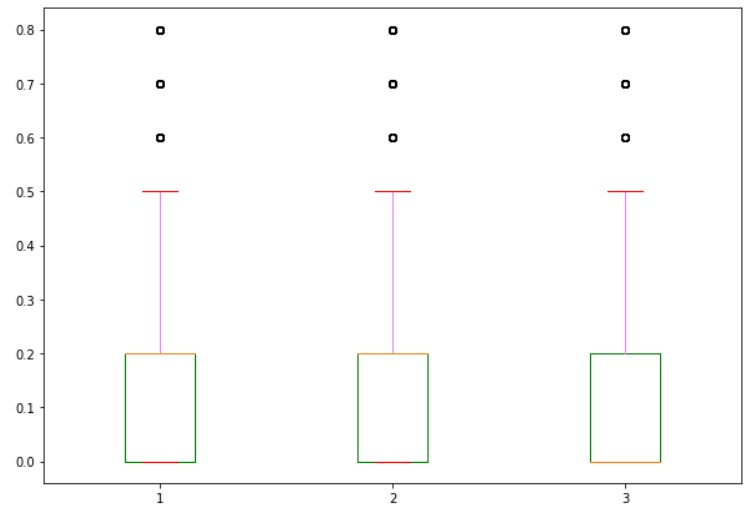
flierprops medianprops and patch_artist Parameter
The circles above the box plot are fliers.
We use flierprops parameter to change the properties of fliers.
We use medianprops parameter to change the properties of a median line
To patch the box, we use the parameter patch_artist.
The below example shows the program to change fliers, median, and patch_artist.
import matplotlib.pyplot as plt
fig = plt.figure(figsize =(10, 7))
plt.boxplot(temp1,flierprops=dict(markeredgecolor='green'),medianprops=dict(color='red'),patch_artist=True)
plt.show()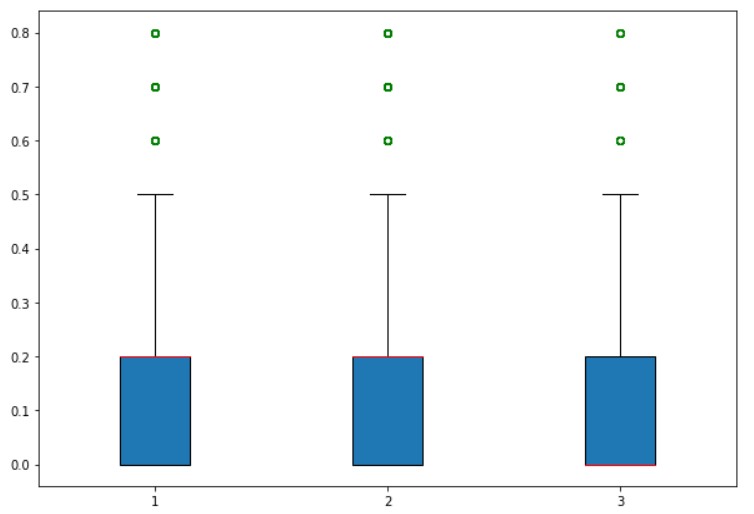
Return Values of boxplot Function
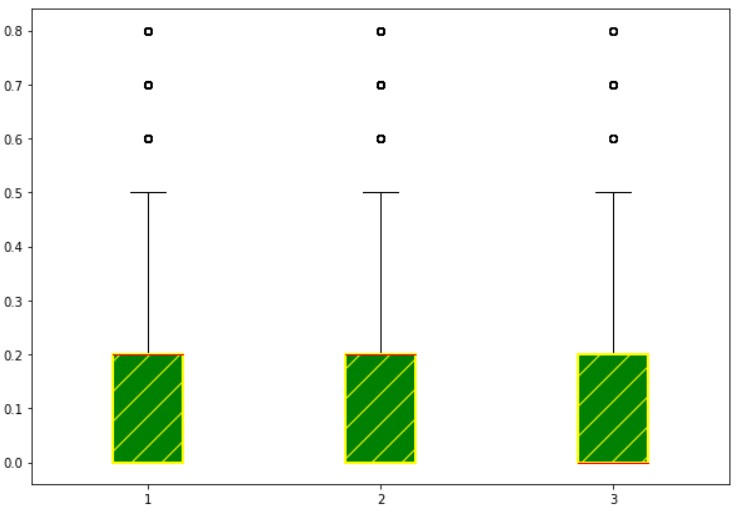
The function boxplot returns a dictionary mapping each component of the box plot.
Boxes are one of the keys in the dictionary returned by the function boxplot.
We can modify the properties of boxes using these returned objects.
The below example shows the output to change the properties of boxes using the returned object.
# Another way to color
import matplotlib.pyplot as plt
fig = plt.figure(figsize =(10, 7))
bp1=plt.boxplot(temp1,patch_artist=True,medianprops=dict(color='red'))
for box in bp1['boxes']:
    box.set(linewidth=2,color='yellow')
    box.set(facecolor='green')
    box.set(hatch = '/')
plt.show()