Figure and Subplot in Matplotlib
In this class, we discuss Figure and Subplot in Matplotlib.
For Complete YouTube Video: Click Here
The reader should have prior knowledge of bar and line charts. Click here.
In our previous classes, we had a basic idea about Figures.
In this class, we will go deep into the functions figure and subplot.
The function Figure is used to construct the graphs.
Whenever we create a figure object, we can place coordinate axes in the figure and plot the graphs.
We can create multiple coordinate axes in one figure. To create the axes, we use the subplot method.
The reader will get clarity about creating multiple subplots in the figure and about axes in the figure.
Figure Method Matplotlib
To understand better, we take an example program given below.
# Creating multiple figures
import matplotlib.pyplot as plt
import numpy as np

t = [1,2,3,4]
s1 = [3,7,8,9]
s2 = [2,4,7,6]

plt.figure(num=1,facecolor="green")# open a new figure
plt.subplot(221)
plt.xticks(t)
plt.plot(t, s1)
plt.figure(num=2) # Taking a one more figure because num is given 2
plt.subplot(222)
plt.plot(t, s2)
plt.xticks(t)
plt.show()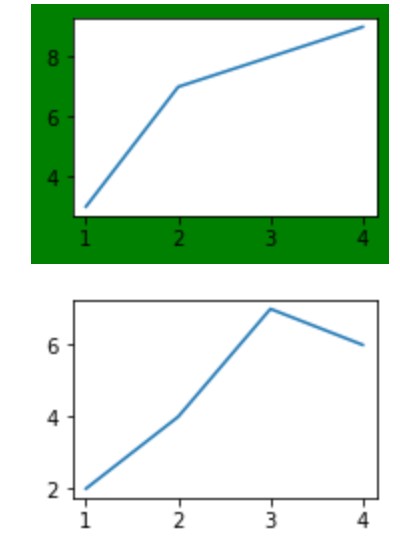
In the above program, we created a figure object using plt. figure() method.
The parameter num is used to assign a unique number to the figure.
We can use that number to represent the same figure in the future code.
If the number is not given, python will take its number.
The face color parameter is used to give a color to the figure.
In our example, we have given green face color to the figure.
We use the subplot method to create a coordinate axis in the figure.
The subplot method will return an axes object. With this axes object, we have many methods to modify the axes.
We discuss those axes methods and the value 221 used in the subplot in a minute.
Would you please check the output of the two figures created in the program?
Example of using the same figure
# using the existing figure
import matplotlib.pyplot as plt
import numpy as np

t = [1,2,3,4]
s1 = [3,7,8,9]
s2 = [2,4,7,6]

plt.figure(num=1,facecolor="green")# open a new figure
plt.subplot(221)
plt.xticks(t)
plt.plot(t, s1)
plt.figure(num=1) # Taking a one more figure because num is given 2
plt.subplot(222)
plt.plot(t, s2)
plt.xticks(t)
plt.show()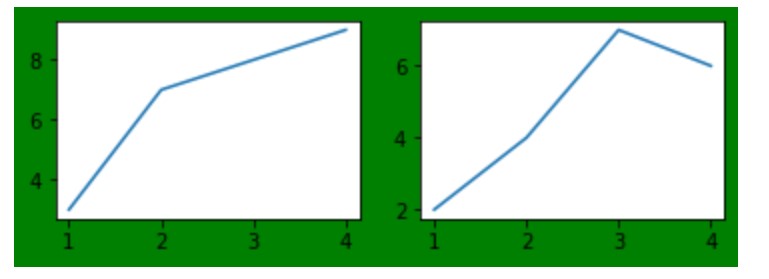
In the above example, we created two subplots in the same figure.
The reader should concentrate on the values given in the subplot method.
Let’s understand the values given in the subplot method.
The first subplot method is given number 221. the first 2 shows rows, and the second 2 shows columns.
The figure is divided into a 2X2 matrix. I.e., we have four divisions in the figure.
The divisions are numbered 1,2,3, and 4.
The third number shows the position in our 2X2 division.
The numbers are given row-wise. The first row is given numbers 1 and 2.
The second row is given numbers 3 and 4.
Line Width and Edge color in the figure
The change in line width and edge color is given in the program below.
#line width and edge color
# using the existing figure
import matplotlib.pyplot as plt
import numpy as np

t = [1,2,3,4]
s1 = [3,7,8,9]
s2 = [2,4,7,6]

plt.figure(num=1,facecolor="green",linewidth=4,edgecolor='red')# open a new figure
plt.subplot(221)
plt.xticks(t)
plt.plot(t, s1)
plt.figure(num=1) # Taking a one more figure because num is given 2
plt.subplot(222)
plt.plot(t, s2)
plt.xticks(t)
plt.show()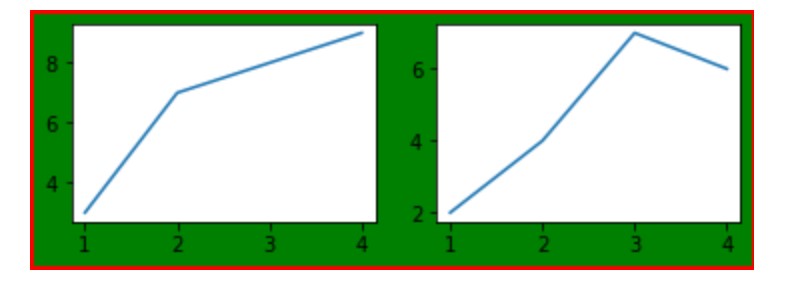
The parameter line width is changed to 4. By default line width of the figure is zero.
Suppose we apply edge color without changing the line width. The color is not visible because the line width is zero.
Change Edge Colour Using Methods of Figure Object
#edge color using methods of Figure object
import matplotlib.pyplot as plt
import numpy as np

t = [1,2,3,4]
s1 = [3,7,8,9]
s2 = [2,4,7,6]

fig=plt.figure(num=1,facecolor="green",linewidth=4)# open a new figure
fig.set_edgecolor('red')
plt.subplot(221)
plt.xticks(t)
plt.plot(t, s1)
plt.figure(num=1) # Taking a one more figure because num is given 2
plt.subplot(222)
plt.plot(t, s2)
plt.xticks(t)
plt.show()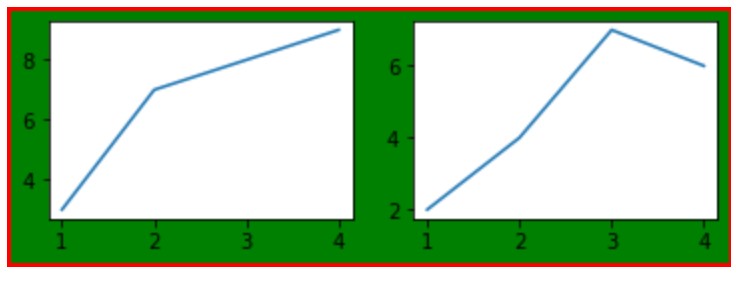
We can change the options of the figure using the methods of the Figure object.
Would you please take a look at the documentation? This reference will help you a lot when you are writing code on your own.
This understanding of the figure and subplot is very important.
We intend to provide the understanding, not to explain to you the methods.
Explaining all methods is not possible. The reader should have the understanding to check the methods according to the requirement.
The set_edgecolor method is used to set the color.
Example showing four subplots in the figure
# Adding Subplot to the figure
import matplotlib.pyplot as plt
import numpy as np

t = [1,2,3,4]
s1 = [3,7,8,9]
s2 = [2,4,7,6]

fig=plt.figure(num=1,facecolor="green",linewidth=4)# open a new figure
fig.set_edgecolor('red')
plt.subplot(221)
plt.xticks(t)
plt.plot(t, s1)
# Taking another sub plot
plt.subplot(222)
plt.plot(t, s2)
plt.xticks(t)
# Taking third sub plot
plt.subplot(223)
plt.plot(t, s2)
plt.xticks(t)
#taking 4th subplot
plt.subplot(224)
plt.xticks(t)
plt.plot(t, s1)
plt.show()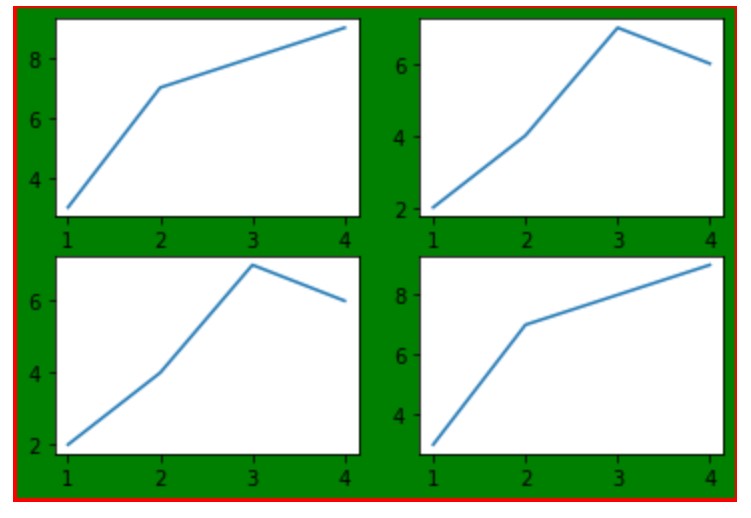
Creating Multiple Subplots Using Subplots Method.
We can use the subplots method to create multiple subplots.
The example of creating one, two, and four subplots are shown below.
#Adding sub plot using subplots method
import matplotlib.pyplot as plt
import numpy as np

t = [1,2,3,4]
s1 = [3,7,8,9]
s2 = [2,4,7,6]

fig, ax = plt.subplots()
ax.plot(t, s1)
ax.set_title('Simple plot')

# two sub plots
f, (ax1, ax2) = plt.subplots(1, 2, sharey=True)
ax1.plot(t,s1)
ax1.set_title('Sharing Y axis')
ax2.plot(t, s2)

# four subplots
fig, axs = plt.subplots(2, 2,sharey=True)
axs[0, 0].plot(t, s1)
axs[1, 1].plot(t, s2)
axs[0,1].plot(t,s1)
axs[1,0].plot(t,s2)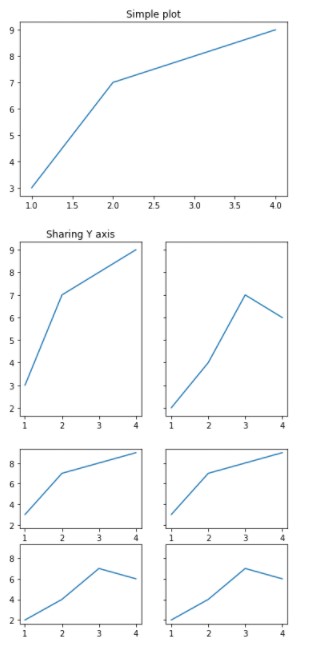
plt. Subplots () are used to create a figure and a subplot.
The method subplots will return a figure object and an axes object.
We use the variable fig and ax variables to take reference of the figure and axes objects.
Once we got the figure and axes objects. We can use the methods to modify figures and axes.
Simple examples are shown above.
plt. Subplots (1, 2, sharey=True) create a figure object and two axes objects.
Fig, ax1, ax2 variables are used to take the references of the objects.
The value 1 shows one row. And the value 2 takes two columns.
Sharey=true parameter is used to share the y axis for both the plots.
Similarly, we can create four axes using the option 2 and 2 in the subplots method.
The method will return the figure and four axes objects. It will return an array of objects.
The objects can be accessed using the two-dimensional array representation shown above.
