Funnel Chart Plotly
In this class, We discuss funnel chart plotly.
For Complete YouTube Video: Click Here
The reader should have prior knowledge of the superstore data set. Click here.
From the superstore data set, we use subcategories and profit to construct a funnel chart.
Funnel charts represent a progressive reduction of data from one phase to another.
Funnel Chart
Example
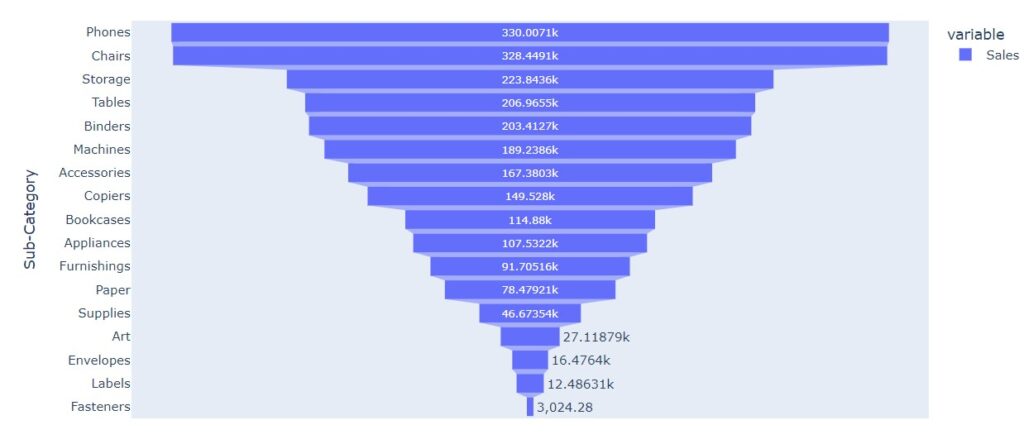
We consider the sales based on a subcategory. The data is sorted based on the sale.
We use plotly express module to construct the funnel chart.
We use the function funnel to construct the funnel chart.
The below example shows the program for the funnel chart.
import pandas as pd
df=pd.read_excel('sampledata.xls',sheet_name='Orders')
print(df.head())

temp=pd.DataFrame(df.groupby(['Sub-Category']).agg({'Sales':'sum'}))
print(temp)

temp1=temp.sort_values('Sales',ascending=0)
print(temp1)

import plotly.express as px
fig = px.funnel(temp1)
fig.show()

The funnel function takes the first record and constructs a bar. Then second record. So on.
As we move down the profit is decreasing. And the graph looks like a funnel.
Stacked Funnel Chart
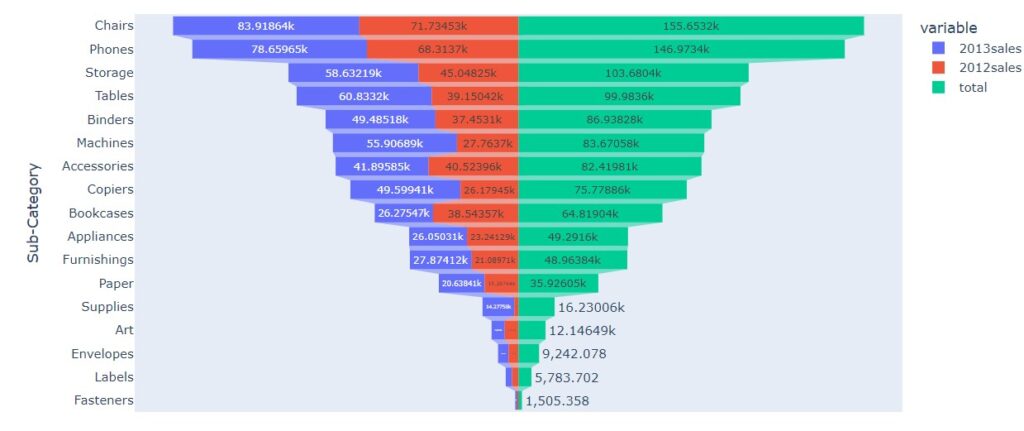
To construct the stacked funnel chart, we take 2012 and 2013 sales based on a subcategory.
The below code shows the program for taking 2012 and 2013 sales and constructing a funnel chart.
df['year'] = df['Order Date'].dt.year
print(df.head())

df1=df[df['year']==2013]
temp2013=pd.DataFrame(df1.groupby(['Sub-Category']).agg({'Sales':'sum'}))
df2=df[df['year']==2012]
temp2012=pd.DataFrame(df2.groupby(['Sub-Category']).agg({'Sales':'sum'}))
final=pd.concat([temp2013,temp2012],axis=1)
final.columns=['2013sales','2012sales']
sumcolumns=final['2013sales']+final['2012sales']
final['total']=sumcolumns
final1=final.sort_values('total',ascending=0)
print(final1)

import plotly.express as px
fig = px.funnel(final1)
fig.show()
We take 2012 sales in a data frame. And 2013 sales in another data frame.
We concatenate the two data frames column-wise.
After concatenating the sum of the 2012 and 2013 sales for subcategories is identified.
Sort the subcategory according to the total sale obtained above and construct the funnel chart.
