Waterfall Chart Python
In this class, We discuss Waterfall Chart Python.
For Complete YouTube Video: Click Here
Waterfall Chart
To construct a waterfall chart in python, we need to install the module waterfallcharts.
Command to install waterfall charts pip install waterfallcharts.
Waterfall charts are used to identify a cumulative effect of a variable over time.
In our superstore data set, we can apply the waterfall model on monthly profits. Learn superstore data set. Click here.
In our example, we use subcategories and profit to display the waterfall plot.
Example
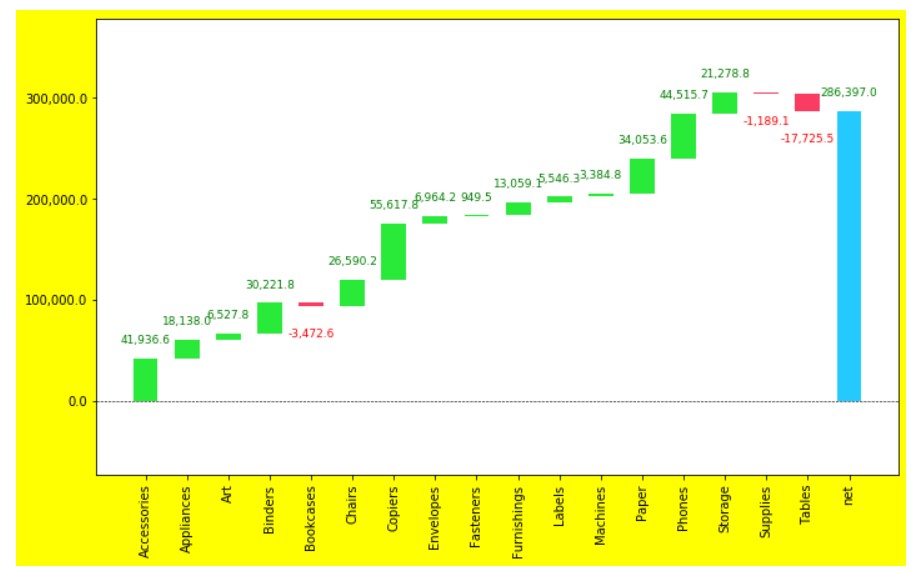
The below program shows the waterfall plot for subcategories and profit.
import pandas as pd
import numpy as np
import waterfall_chart
import matplotlib.pyplot as plt

import pandas as pd
df=pd.read_excel('sampledata.xls',sheet_name='Orders')
print(df.head())

temp=pd.DataFrame(df.groupby(['Sub-Category']).agg({'Profit':'sum'}))
print(temp)

x=temp.index
y=temp['Profit'].values

z=plt.figure()
plt.rcParams["figure.figsize"] = (10,6)
plt.rcParams["figure.facecolor"]="yellow"
waterfall_chart.plot(x, y,)
plt.xticks(rotation=90)
plt.show()
First, understand the waterfall chart. Then we understand the code.
In the output, we have a subcategory on the x-axis. And Profits on the y-axis.
The cumulative effect of the profit for each subcategory is shown.
The last bar is showing the total profit. And it is given the name net.
For better practice, the reader should apply the waterfall model on month and profit.
In our previous classes, we discussed taking a month and year from the date.
In the above program, we use rcparams to define the figure size and color. Click here.
net_label and rotation_value
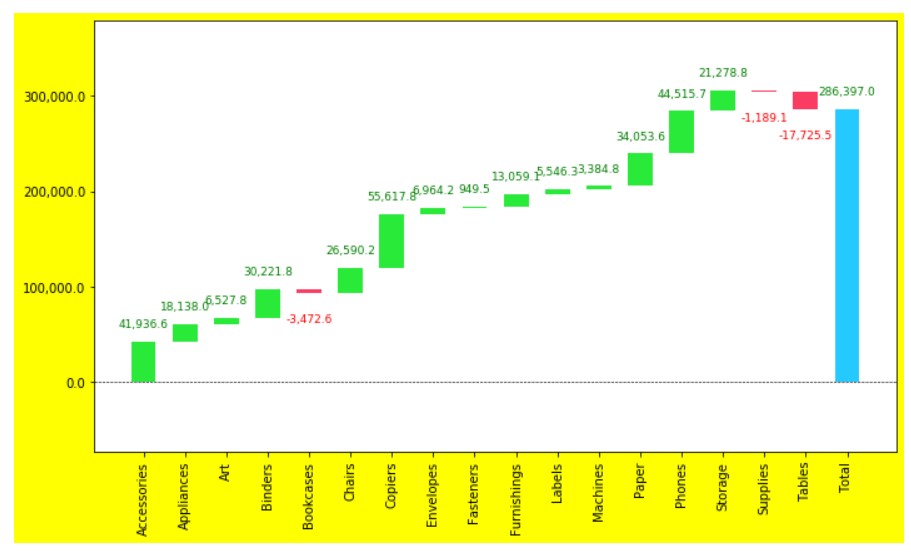
We use the parameter net_label to change the name of the last bar.
We use the rotation_value parameter to rotate the x-axis labels.
The below examples show the program using net_label and rotation_value parameters.
# net label and rotation
z=plt.figure()
plt.rcParams["figure.figsize"] = (10,6)
plt.rcParams["figure.facecolor"]="yellow"
waterfall_chart.plot(x, y,net_label='Total',rotation_value=90)
plt.show()
sorted_value
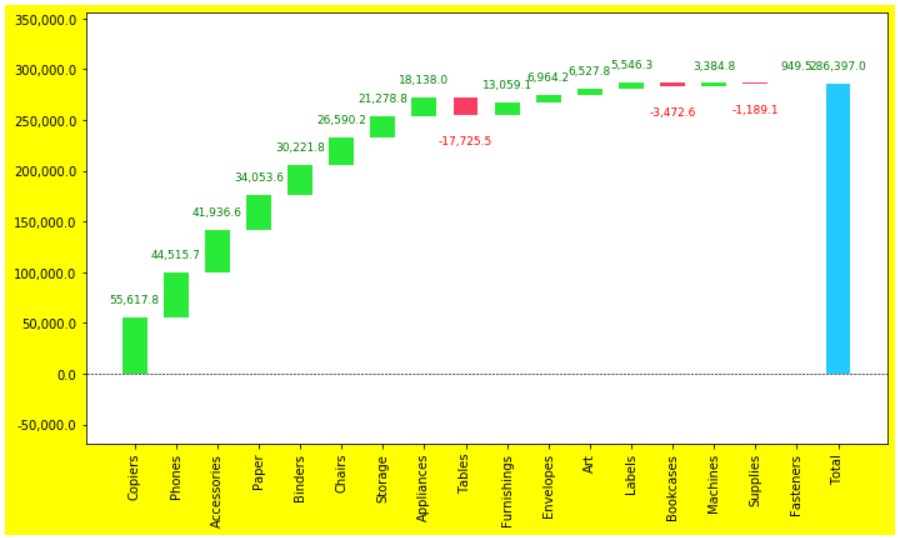
We use the parameter sorted_value to arrange the profits in the sorted order.
sorted_value parameter will consider the value to sort the profits.
The below example shows the program to display profits in descending order.
z=plt.figure()
plt.rcParams["figure.figsize"] = (10,6)
plt.rcParams["figure.facecolor"]="yellow"
waterfall_chart.plot(x, y,net_label='Total',rotation_value=90,sorted_value=True)
plt.show()
